Debugging latency
In the recent decade, our systems got complex. Our average production environments consist of many different services (many microservices, storage systems and more) with different deployment and production-maintenance cycles. In most cases, each service is built and maintained by a different team — sometimes by a different company. Teams don’t have much insight into others’ services. The final glue that puts everything together is often a staging environment or sometimes the production itself!
Measuring latency and being able to react to latency issues are getting equally complex as our systems got more complex. This article will help you how to navigate yourself at a latency problem and what you need to put in place to effectively do so.
Latency
So, what is latency? Latency is how long it takes to do something. How long does it take to have a response back? How long does it take to process a message in a queue?
We use latency as one of the core measures to tell whether a system is working as intended end-to-end. On the critical path (in the lifetime of a user request), latency is the core element that contributes to the overall user experience. It also allows us whether we are utilizing our resources as expected or our throughput is less than our trajectory.
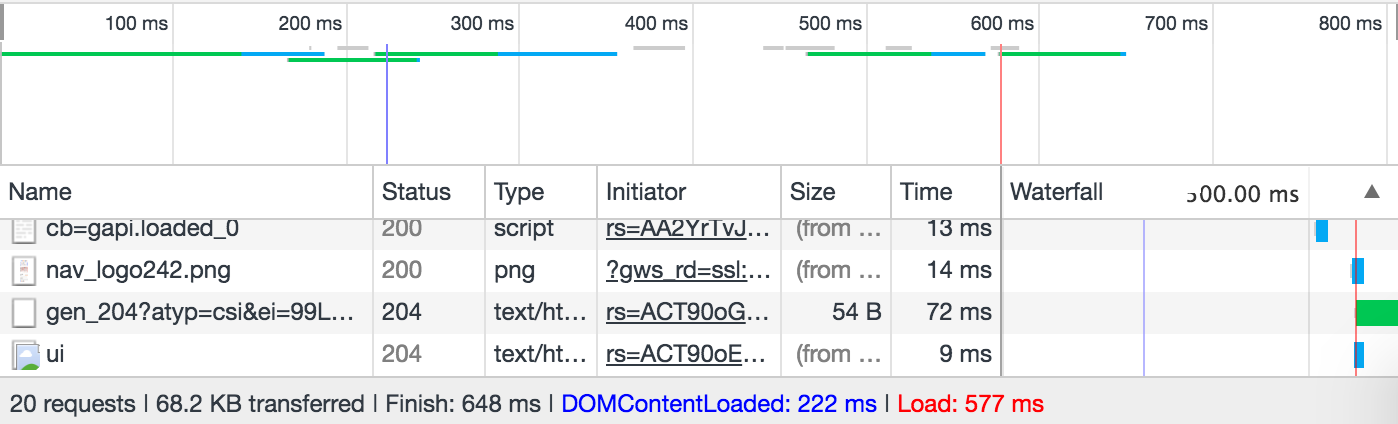
Even if you are not engaging with latency measurement, you might be already familiar with various tools on a daily basis that reports latency results. As a daily example, various browser developer tools report the time it takes to make all the requests that make up a web page and report the total time:
Latency is a critical element in the SLOs we set between services. Each team set an SLO for their service (e.g. 50th percentile latency can be 20ms, 90th percentile latency can be 80ms, 99th percentile can be 300ms) and monitor their latency to see if there are any SLO violations. (Watch “SLIs, SLOs, SLAs, oh my!” to learn more about SLOs.)
But how do we systematically collect and analyze request latency in today’s production systems?
We measure latency for each request and primarily use metric collection systems to visualize and trigger auto alerts. Latency collection is unsampled (we collect a latency metric for every request) and is aggregated as a histogram distribution to provide visibility to the higher percentiles.
You can use your choice of collection libraries to collect latency metrics.
Is there unexpected latency?
In order to detect anomalies in latency, we need to first answer what would be considered as expected latency. Every service has different requirements what unexpected latency can be. It is almost impossible to have services with 100% reliability, hence we need to first determine what latency range would give user an experience that they wouldn’t recognize there is a problem.
“For inbox.GetEmails call, 99th percentile request latency should be less than 300ms.” is an example SLO where we set the 99th percentile upper bound for latency for the inbox service’s GetEmails method. There might be requests that took more than 300ms but would not violate the SLO if there are not making to the 99th percentile. You can define your SLOs in a lower or higher percentile. (Watch How NOT to Measure Latency to understand why percentiles matter.)
When an SLO violation occurs, we can automatically trigger alerts and ping the on-call person to take a look. Or you can hear from a customer that they are expecting poor latency and ask you to resolve the issue.
What is the source of latency?
When an alert is triggered or a customer is reaching out to you, an on-call person is expected to take a look. At this point, they know that there is a latency violation or poor experience. We often know what specific service/method it is but no idea the underlying cause. At this point, we can look at the latency distribution heat map for the service/method.
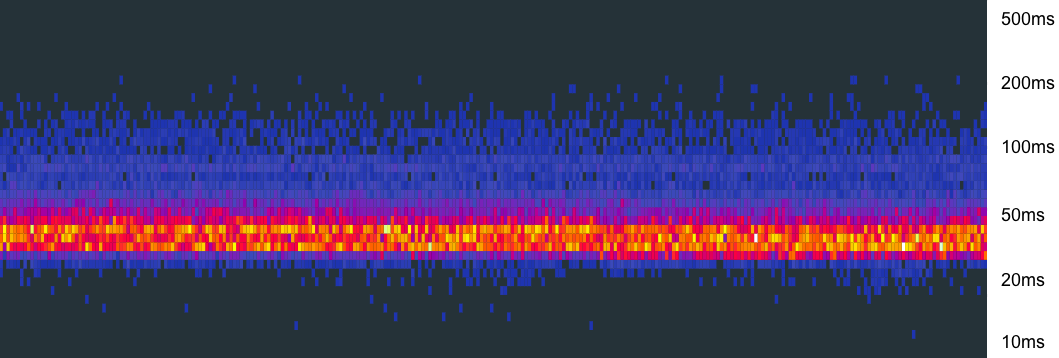
Heat maps visualize latency distribution over time; x-axes is the time and y-axes is the latency bucket the measurement fell into. We recently started to correlate latency distribution buckets with exemplar traces that fits into that bucket. This allows us to find a trace from a particular latency bucket when debugging latency issues. (Watch Resolving Outages Faster With Better Debugging Strategies for more details.)
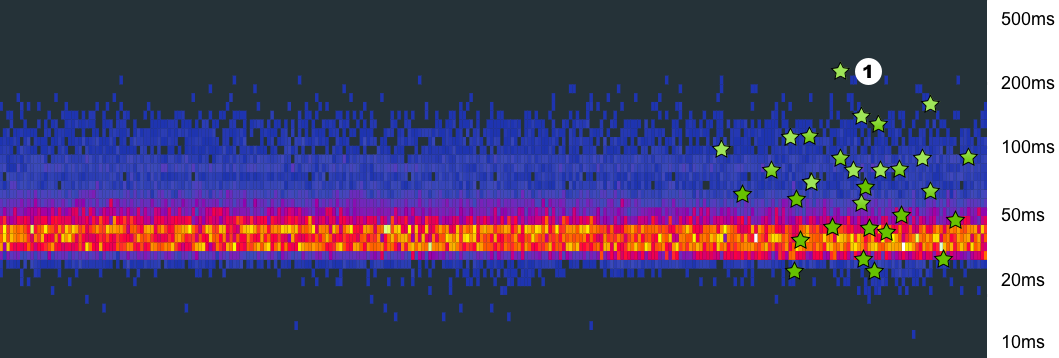
(*) Each green star represents an exemplar for the bucket. When you click on it, it takes you to the trace exemplar and you can see the distributed trace for one of the calls that fell into that bucket.
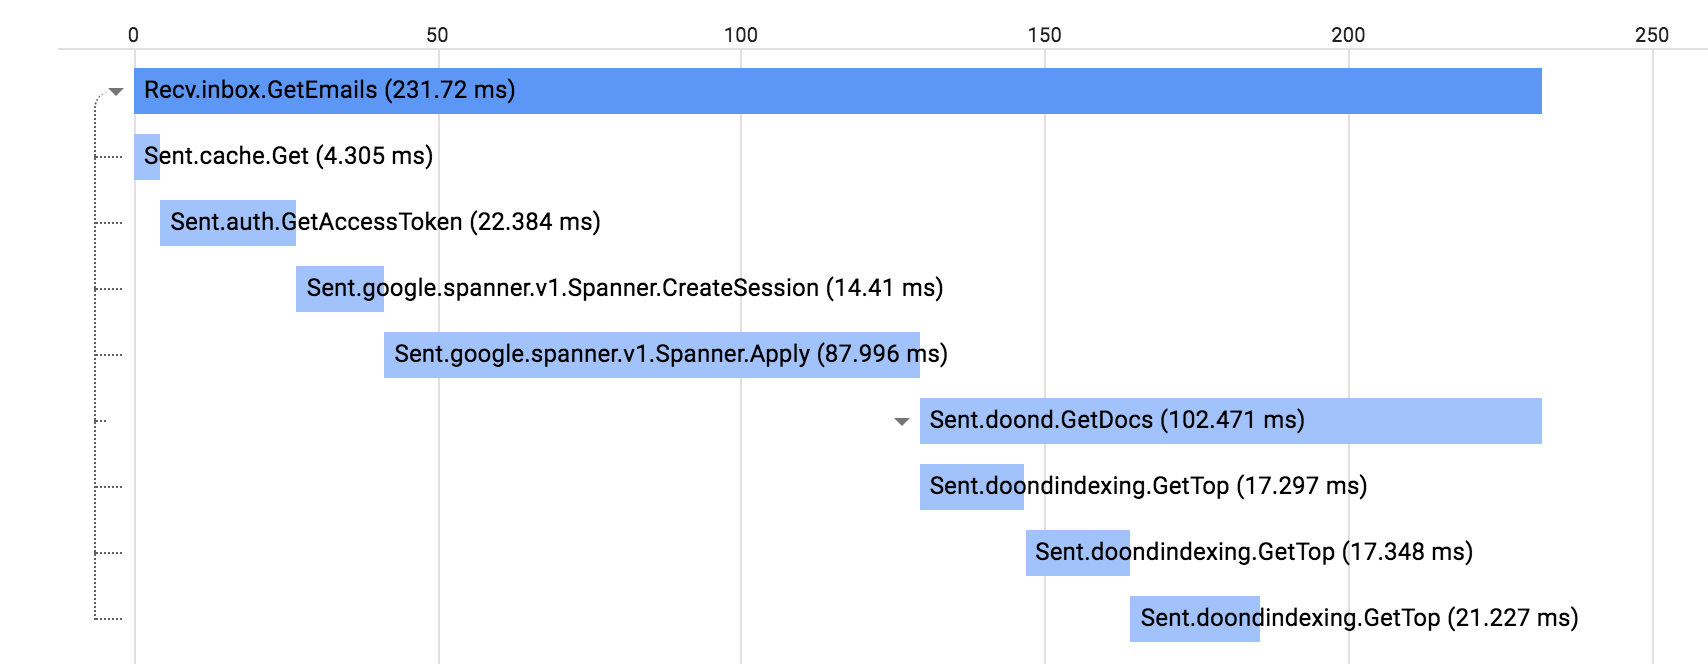
A click on a star is taking you to the trace where you can see what has happened in the lifetime of that request more granularly. Traces can navigate us to the underlying issue. It will be possible to identify the case if there is an unexpected outage in one of the services we depend on, or a networking problem or an unlikely latency issue.
Once we examine the trace related to the latency bucket at (1), we see Spanner.Apply call took longer than it should from for this particular trace and there are an additional 40ms spent in the doond.GetDocs for a non-RPC job we don’t have additional information about.
Addressing the latency problem
Metrics and traces can navigate you where the latency is rooted but might not be the primary tool understand the underlying cause of the latency. Poor scheduling, networking problems, bad virtualization, language runtime, computationally expensive code and similar problems might be the possible reasons.
Once we narrowed down the source of the latency to a service and sometimes to a specific process, in order to understand the underlying cause, we look at the host-specific and in-process reasons why latency occurred in the first place. For example, a host-specific signal to look at is the utilization and memory metrics.
If the host is behaving normally and networking is not impacted, we may go and further analyze the in-process sources of latency.
Often, servers are handling a large number of requests and there is no easy way to isolate events happened in the lifetime of a request. Some language runtimes like Go allows us to internally trace runtime events in the lifetime of a request. Tools like runtime tracers are often very expensive and we momentarily enable them in production if we are trying to diagnose a problem. We momentarily enable collection, try to replicate the latency issue. We can see if latency is caused by I/O, blocking or stopping-the-world events triggered by the runtime. If not, we can rule out those possibilities.
And sometimes latency is caused by computationally expensive code. For example, if you roll out a new version that is depending on a new compression library, you may experience higher latency than the usual. Being able to label profiler samples with an RPC name is critical to understand the cost of a particular RPC on your server.
Latency is a critical measure to determine whether our systems are running normally or not. Even though metrics can tell whether there is a latency issue, we need additional signals and tools to analyze the situation further. Being able to correlate diagnostics signals with RPC names, host identifiers and environmental metadata allows us to look at various different signals from a particular problem site.